How do we produce the Almanac?
Overview
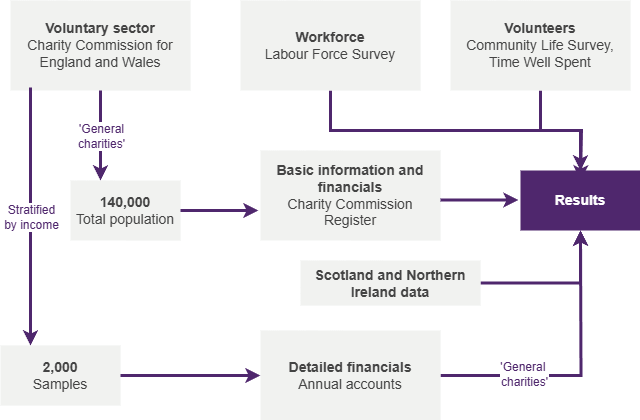
We estimate the size, scope and finances of the UK voluntary sector using two sources of data:
- data for all registered charities based on the Charity Commission register
- detailed financial data for a sample of charities using their financial accounts.
NCVO has collected this core data for over ten years.
Covering the whole population of 'general charities'
- The Charity Commission register holds data for all registered charities in England and Wales.
- This data is used to provide basic information on the whole population of charities after we have applied our ‘general charities’ definition.
A sample of the financial data
- Data is obtained for a sample of 10,000 charities by taking their financial accounts and manually inputting them into a database.
- For the Almanac, we include only those charities that meet the ‘general charities’ definition.
- This data is then weighted up to the total population, to provide detailed information on income sources and types of spending.
Creating a view across the UK
To provide an overall picture for the whole of the UK, aggregate data for Northern Ireland and Scotland is added.
Supplementing the data
- We supplement this core financial data with analysis of the Community Life Survey, NCVO’s Time Well Spent survey, the Labour Force Survey and a range of other data sources.
- We also work in partnership with CharityJob to produce estimates of the number and types of vacancies, and average salaries offered in 2023, and how this has changed since 2019, based on jobs posted on the CharityJob website. This used a subset of the data underpinning the CharityJob Salary Report 2024.
Voluntary sector data
Financial data
Financial information for voluntary organisations is based on financial accounts data submitted to the Charity Commission. The Charity Commission publishes some of this information in its register of charities:
- Total income and spending of all registered charities.
- More detailed financial information for all registered charities with an annual income of £500,000 or more (known as ‘part b’).
This digital data forms the basis of financial data in the Almanac and provides the total figures for income and spending for all registered charities.
However, the data available digitally is somewhat limited:
- Only larger charities have to submit financial data beyond total income and spending.
- Part b data does not give very detailed information about different income types or sources.
Therefore, we extract detailed financial information from PDF-documents of submitted annual reports manually.
A new 10,000-sample dataset
Until last year we obtained the manual submission from over 10,000 samples. This year we have put a more robust mechanism in place, which works off a 2,000-sample dataset.
Out of the 10,000 sample, around 7,000 to 8,000 records would fall into the 'general charities' definition. The 2,000-account sample only consisted of 'general charities' accounts.
The Centre for Data Digitisation and Analysis at Queen’s University Belfast carries out the manual data entry process.
Sampling the financial data
The original sample design was based on a random sample of charities stratified by their size in terms of annual income. Income was used because this variable is both a key determinant of sampling error and a key variable for analysis.
Different sampling fractions are applied to the different strata (income bands) with fractions increasing with the size of organisations.
Most major organisations (income £10m to £100m) (83%) and all super-major organisations (income over £100m) are sampled. However only about 2.5% of small charities (income under £100,000) are sampled.
Data is weighted at the analysis stage to take account of the different sampling fractions, allowing us to estimate the size of the total sector.
Adapting the strategy for a new dataset
The above sampling strategy works well with a 10,000-record sample, but when moving to a 2,000-record sample, we found it more efficient to capture a higher percentage of larger charities.
This resulted in about 1% of the sample coming from micro organisations (income under £10,000) and 2% from super-major organisations (income over £100m). Approximately 65% of the sample came from medium (income between £100,000 and £1m) and large (income between £1m and £10m) organisations.
Out of all the 166,000 charities in the UK, 1.4% was finally sampled. The largest of these was the super-major class (74%) followed by major (38%).
While the numbers look heavily skewed to larger charities, in reality this is not the case. The larger charities usually have the most varied financial sources, helping gauge a better understanding of the sector and its finances. As charities get smaller their sources for incomes, expenses and assets get less diverse, therefore providing less detail.
Data classification
In the Almanac, the income of voluntary organisations is classified by type and source. This is one of the main features of the Almanac analysis and takes up most of the time during data processing.
Income type describes how the income is obtained:
- Voluntary income: donations, grants or legacies
- Earned income: contracts, membership fees, charity shops, or fundraising activities
- Investment income
The source of income describes who has provided the income:
- The public
- Government
- Voluntary sector
- Corporate/business sector
- National Lottery
- Investment income
To classify the data, we use a combination of machine learning, keyword matching and, for a small proportion, manual classification.
The key concept is to look at descriptions of financial records which state the source of each record. When this text is analysed, along with a record of historical data, the model is effectively able to segregate each value into the right category.
While both the machine learning (ML) model and keyword matching work on the same concept of keyword-based classification, the ML model takes a more intricate approach of probabilistic matching, while Keyword matching is more direct.
Together, the two algorithms provide a more robust mechanism. The keyword matching algorithm is allowed to override the ML model, providing a certain threshold is achieved for the description.
Finally, the manual model takes manual inputs where a human provides a category for a given text, which overrides everything. This manual input can then, in future years, help make the ML model stronger by providing an updated score for the outputs.
Data cleaning
The data is then cleaned to remove errors and undergoes a series of checks to ensure validity.
These checks include:
- Comparison of income, expenditure and assets data between this year and last year to look for particularly large increases and decreases (which might indicate anomalies or errors).
- Construction of various ratios between financial variables (for example between income and expenditure, and investments and dividend income) to look for anomalies.
- Manual checking of annual accounts submitted by super-major (and some major) charities.
In 2024, we implemented two new checks:
- Classification proofing: Enhanced financial classification to ensure that a predicted class is accurate, by enhanced algorithmic verification.
- Machine learning (ML) enhancement: Implementation of a stronger ML model for classification that works in parallel with keyword classification rather than in series as previously.
Consistency of financial values
- Where accounts are submitted in a foreign currency, all values are converted to Pounds Sterling using an average of the exchange rate over the year.
- Organisations have a range of financial year ends, distributed throughout the year. To assist consistency, all values are converted to April 2022 prices using the retail price index (RPIX).
- The retail price index (RPIX) is also used for trend data to convert actual values from previous years to April 2022 prices.
Producing UK totals
Once the data is cleaned, ratios are produced for all financial variables in the sample within each income band and are multiplied up to the England and Wales population size using weights based on income bands.
These ratios are also applied to supplementary data from SCVO (Scottish Council for Voluntary Organisations), OSCR (Office of the Scottish Charity Regulator) and NICVA (Northern Ireland Council for Voluntary Action) to produce estimates of the UK population.
Assigning organisations to a subsector
Subsectoral analysis in the Almanac is based on assigning organisations to categories in the International Classification of Non-profit Organisations (ICNPO).
The ICNPO is a classification system for non-profit organisations designed by the Center for Civil Society Studies at Johns Hopkins University in the US as part of efforts to draw up a UN Satellite Account for the non-profit sector. It is the most useful tool to classify and compare different groups of voluntary organisations, and is used throughout the Almanac.
The classification is done through a variety of different methods. This includes keyword searches matching to other registers and looking at individual sources.
As the original system was not a perfect fit for the UK voluntary sector, several categories were added for specific types of organisations that occur in large numbers (such as scout groups and nurseries).
For more information about the different categories, have a look at our definitions in the Almanac.
Allowing for multiple activities
In practice, many organisations undertake multiple activities (such as housing and advice), but the ICNPO groups organisations into a single category based upon their primary activity.
The advantage of the ICNPO over a multi-dimensional classifications system (such as the classification system used by the Charity Commission), is the ability to look at and compare discrete groups of charities.
Like all classifications, this classification is not perfect. However, it does allow for the comparison of groups of charities and it does cover the activities of the whole sector.
Workforce data
Labour Force Survey
Our workforce figures are based on the Labour Force Survey (LFS).
The LFS surveys around 38,000 households every quarter. By pooling data for unique individuals from four quarters, it is possible to produce reliable estimates of the voluntary sector’s workforce.
Weighting is used within the LFS to compensate for non-response rates in certain groups and produce population estimates.
The figures for each quarter presented in the Almanac are calculated by using a moving or rolling centred average over four quarters [1]. This ensures some seasonality is smoothed out and that all four quarters are represented in any given year.
To identify the sector in which a respondent is employed, we use a two-stage self-classification process.
Respondents are first asked whether they work for ‘a private firm, business or a limited company’ or ‘some other kind of organisation’.
Those respondents who choose the second option are then asked, ‘what kind of non-private organisation is it?’.
They are then presented with a range of options including ‘charity, voluntary organisation or trust’.
For the purposes of the analysis for the Almanac, responses to these questions are recoded into ‘private’, ‘public’ or ‘voluntary’.
Volunteering data
Community Life Survey
The Almanac analysis on volunteering trends draws largely on the Community Life Survey (2012/13 to present) and its predecessor, the Citizenship Survey (2001 to 2010/11). These are the best sources of trend data on rates of volunteering in England.
Since 2016/17, the Department for Digital, Culture, Media and Sport (DCMS) has commissioned the survey annually. It is representative of adults aged 16 and over in England.
The survey covers both ‘formal volunteering’, which takes place through a group, club or organisation; and ‘informal volunteering’, which includes volunteering time to help others independently of an organised group.
Unless otherwise stated, data is drawn from the most recent survey and includes the appropriate weighting.
There was a gap in the data in 2011/12, during the transition between the two surveys, although this did not disrupt the time series.
In 2016/17, however, the data collection method changed. The survey moved from being a face-to-face interview to an online/paper version which respondents complete themselves (self-completion with no interviewer assistance).
This move meant significant savings in costs, allowing DCMS to increase the sample size from 3,027 in 2015/16 to at least 10,000 a year now. However, it also has a significant impact on response rates and question responses, affecting trend data due to sample, response and mode effects.
Time Well Spent
The volunteering section also draws on the latest NCVO Time Well Spent survey, carried out in 2022.
This focused on the experiences of volunteers and the volunteer journey. The survey was completed by adults aged 18+ in Great Britain through YouGov’s panel, via an online self-completion questionnaire.
The total sample achieved was 7,000 respondents. The data was weighted to reflect the national population by key demographics: age, gender, education level and social grade.
Vacancy and salary data
CharityJob Salary Report 2024
CharityJob, our Almanac salary data partner, provided and analysed data on job vacancies and salary levels.
Overview figures are based on data from all 48,000 jobs posted on CharityJob’s website in 2023 and using data from the CharityJob Salary Report 2024, which includes data on average salaries for different job types in the charity sector, and salary trends across the UK charity sector.
The bespoke data findings produced by CharityJob for the Almanac are based on the 29,100 UK-registered charity job vacancies posted by organisations in 2023 that meet the NCVO’s definition of general charities. This is 47% of the total jobs posted.
Comparisons are made to equivalent data from 2022 to show how the recruitment market has changed.
Footnotes
-
↩
Find out more about the impact of reweighting on Labour Force Survey key indicators, UK: 2020 on the ONS website.